
written by Ana Honcu, Post-doc researcher, University of Iași
This article is about mapping the veterans’ inscriptions from Upper Moesia using ArcGIS software. How can this be done and toward what aims? By applying GIS algorithms to these datasets, we can make various maps and queries that allow us to discuss distribution and spatiality from many different angles. Such an experiment provided us the possibility of better visualization of data in a geographic context and allowed us to identify the specific locations of inscriptions and thus draw conclusions about veterans’ settlements.
A geographic information system (GIS) is a system that creates, manages, analyses and maps all types of data. GIS connects data to a map, integrating location data (where things are) with all types of descriptive information. Simply stated, GIS technology provides a foundation for mapping and analyzing data in a geographical context. This allows better visualization of data in a unique format that leads to discoveries regarding patterns and relationships about and between the data itself. GIS technology is increasingly employed in the field of archaeology, but it has not yet been extensively applied to epigraphic datasets. Rebecca Benefiel’s study of wall inscriptions from Pompeii offers an excellent demonstration of the potential of this technology in answering historical questions.
Fig. 1.png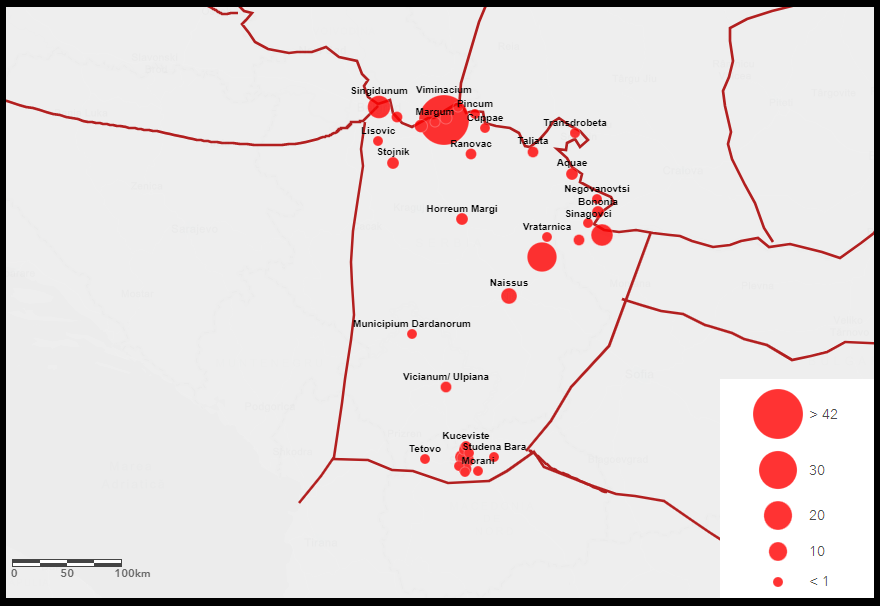
We believe that GIS technology can be applied with great benefit also to the study of the veterans’ inscriptions from Upper Moesia. The province of Upper Moesia was selected as an area of interest for quantitative GIS exploration because it had a significant military presence, therefore a representative number of inscriptions, which can be used as indicators for the three measured variables: Roman veterans, their origin, and place of establishment. Creating a digital database that could be keyed to a geo-referenced map would greatly facilitate research involving inscriptions and spatial analysis. Our study has two goals: to demonstrate the usefulness of the application of GIS to a database containing an epigraphical corpus and to identify the main centers of settlement of veterans.
Fig. 1.2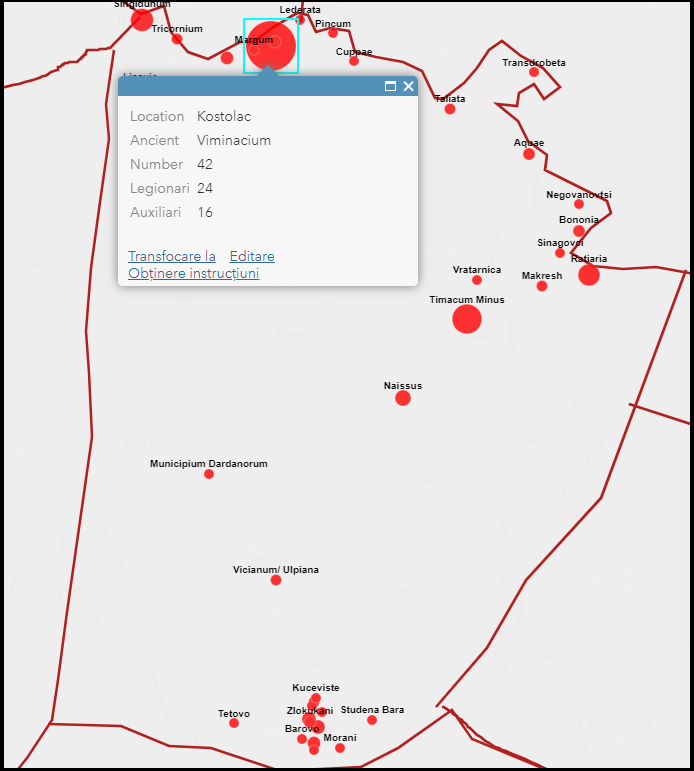
The database was comprised of 164 inscriptions, collected from epigraphic corpora or online epigraphic databases. Fig.1, 1.2 displays the location of all veterans (legionaries and auxiliaries) in the province. The distribution of veteran settlements in Upper Moesia presents an expansive, complex spatial arrangement with 40 settlements of veterans. We can draw a first general conclusion – the preferred areas are the northern, southern, and northeastern provincial borders, cities with colonial (Scupi, Ratiaria) or municipal status (Singidunum, Horreum Margi, Naissus, Ulpiana), the provincial capital (Viminacium), legionary and auxiliary camps (Timacum Minus) castella (for example Bononia), but also settlements with economic potential.
Fig. 2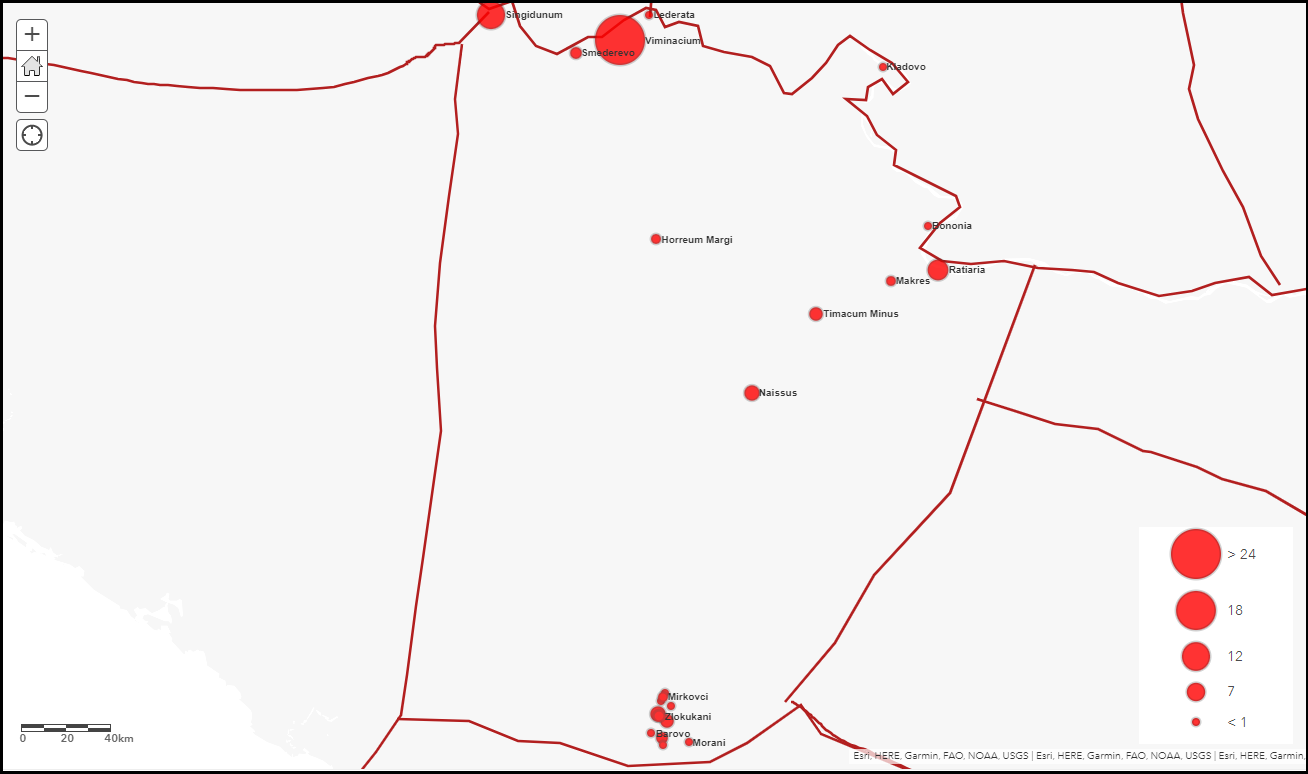
Fig. 2.1 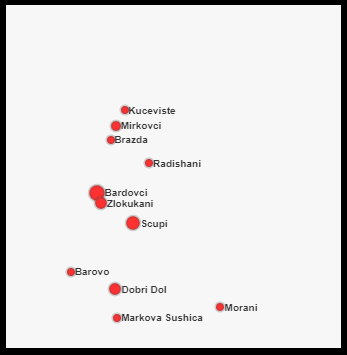
The following two maps pinpoint the locations of legionary (Fig 2, 2.1) and auxiliary veterans (Fig. 3). It can be stated that the use of ArcGIS maps and a specific database clearly help map separate categories of inscriptions. Not only the high concentration of inscriptions has a big visual impact, but so does their spread as well, because no part of the territory is empty. This could not be created without digital aid, and the maps illustrate how the topographical distribution of inscriptions can be analyzed in greater detail to provide a multi-layered picture of veterans. ArcGIS maps show that there is a visible clustering: the most numerous veterans come from the two legions stationed in the province (legio VII Claudia and legio IIII Flavia Felix) and the dispersion of the legionary veterans being present in the north and south of the province. Ex-soldiers settled in the north were located near the legionary camps, and the veterans settled in the south of the province were settled through deductio agraria. Most auxiliary veterans settle in the place where they performed their military service (for example, Timacum Minus).
Fig. 3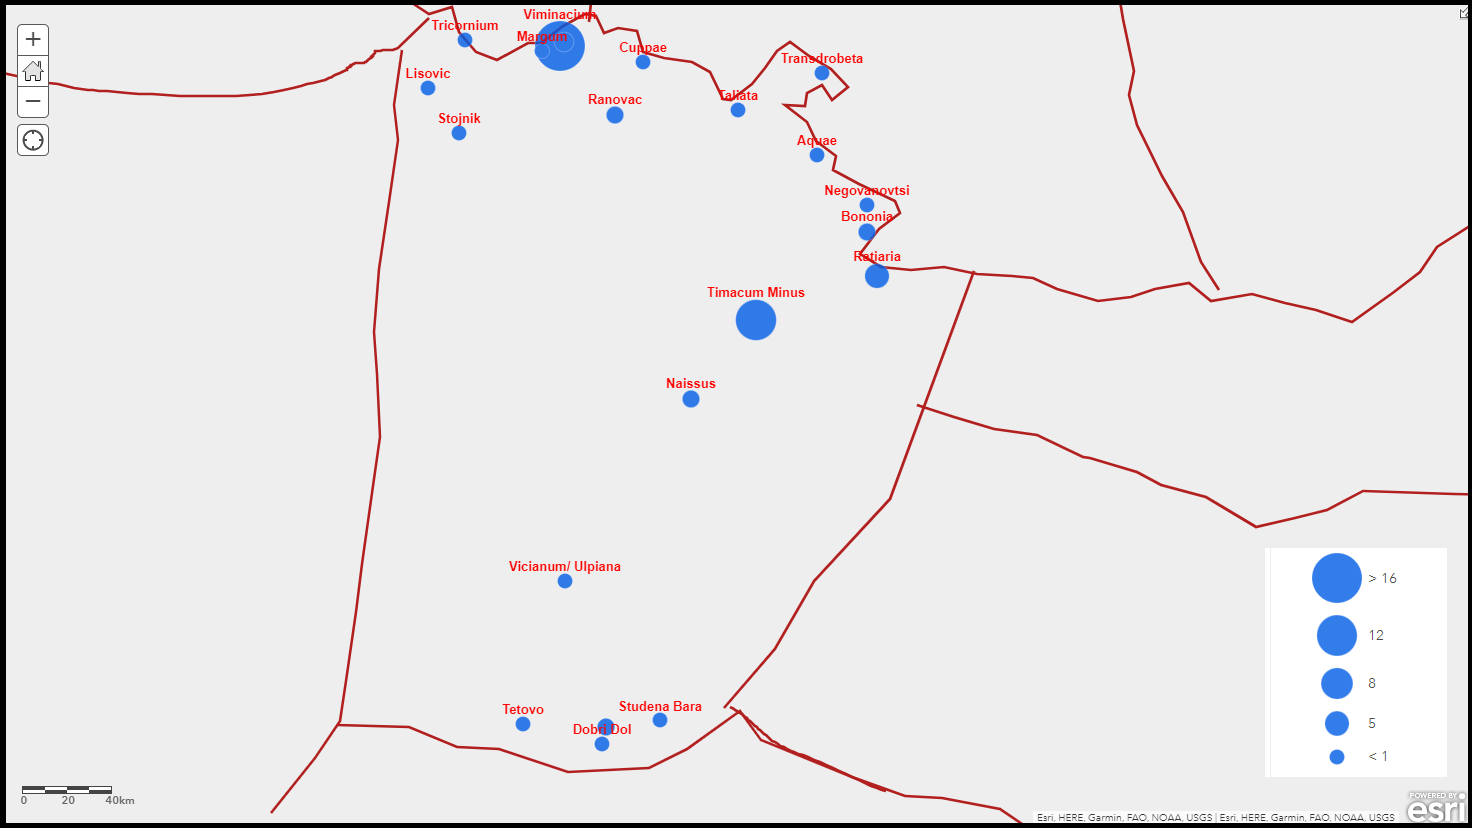
Fig. 4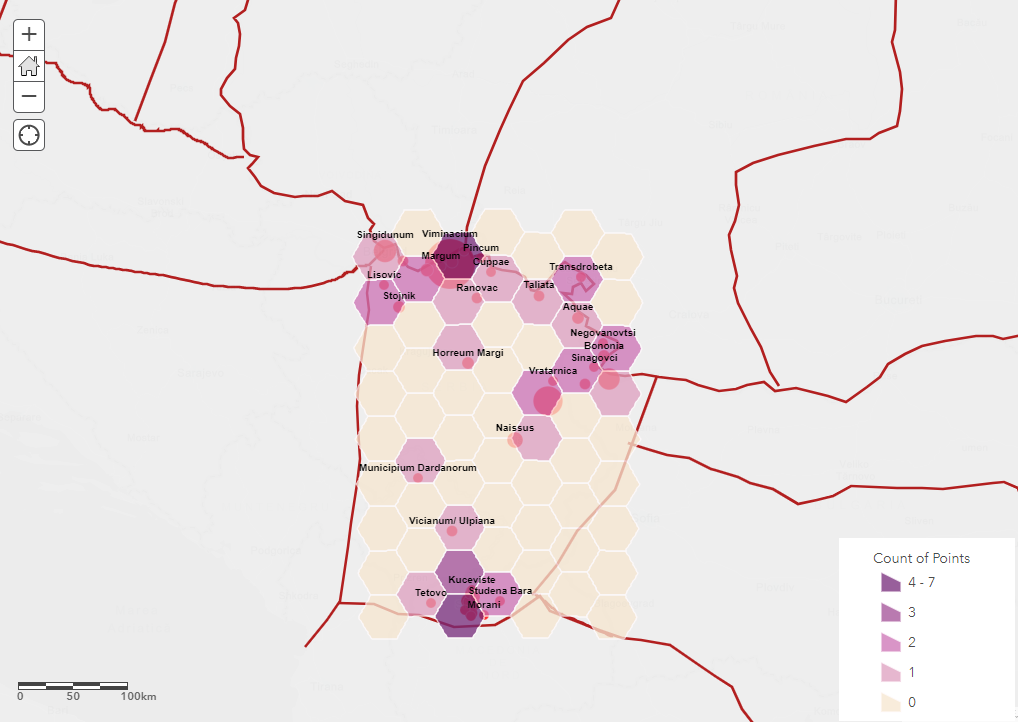
Fig. 4.1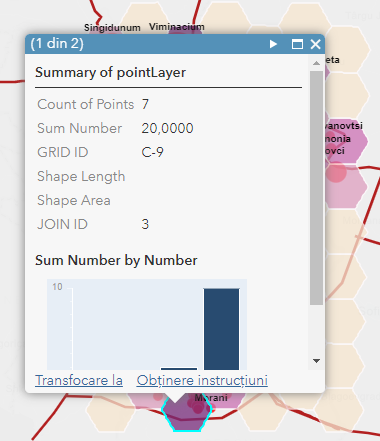
We have also applied some spatial analysis, in order to extract new information and meaning from the original data. The result of summarizing data tool is a new layer with polygons (grid/area) with a size of 40 km. The analysis calculated the number of points (location of veterans) that fit into each surface and the total number of inscriptions from the grid/area (Fig. 4, 4.1). The find locations tool identified existing features that meet a series of criteria we specify. In our case, the analysis pinpointed legionaries established at a distance of 200 km from the military camps (Fig. 5).
Fig. 5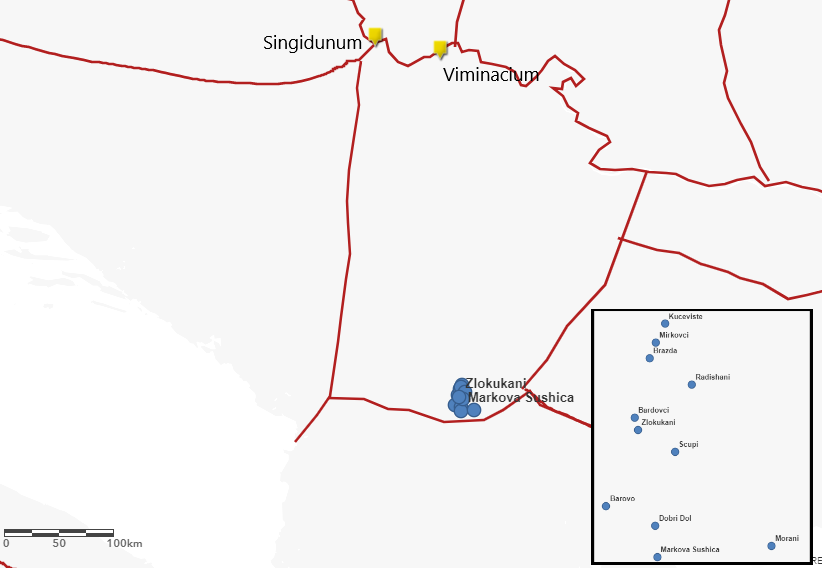
In conclusion, viewing results on an interactive map offers the possibility to adjust and adapt analysis until we find the answers we need. Interactive maps create immersive experiences that transform maps from a static view into an opportunity for users to explore. The results demonstrate the potential of the GIS approach in testing the hypotheses produced by traditional epigraphic studies.
